Citation Graph of Scholarly Literature
A second project done as part of the Data CDT’s GEOG5995M/ENVS802 module: Programming For Social Scientists.
It is ‘licensed’ under the The Unlicense, and available on my Github.
README Contents: Installation and Quickstart. Task. Background Research. Software Design. Documentation. Conclusion.
Installation and Quickstart
To run this on your machine you need to have Git and Python installed. If you don’t, use your system’s recommended package manager to download them from the command line. (For Windows, use Chocolatey.)
Then clone the Github repository, and navigate into the project folder. You can then immediately run the program:
python --version
git --version
git clone https://github.com/peterprescott/citation-graph
cd citation-graph
pip install pipenv
pipenv shell
pipenv install
python run.py
The program will be initially running on data that I’ve already entered, saved in the SQLite database citation-graph.db. (Note that the visualized nodes do sometimes get stuck in the top left of their SVG field – if that happens just click-and-drag them down with your mouse cursor).
To prove the functionality of the program, let’s delete the database file, and then recreate it.
rm citation-graph.db
You can still keep the web-page interface open, but if you try clicking Load More Data, the Python code will report sqlite3.OperationalError: no such table: texts. But we can quickly recreate the database (which is generated from .bib files in the bib_files\ folder – more on that later!)
Now you will be able to Load More Data. And indeed if you want you are able to load your own data.
But let’s slow down and start at the beginning…
Task
Our brief for this assignment was as follows:
This assignment is a major project building up a model, application, or analysis from scratch. The project can be either something of your own invention, or one of the [suggested] projects… Broadly speaking, your project should:
- Read in some data.
- Process it in some way.
- Display the results.
- Write the results to a file.
After a brief attempt at one of the suggested projects, I instead decided to do something relating more directly to my – and potentially anyone’s! – PhD. I decided to create some software to help visualize the webbed citation relationships of scholarly literature for an area of study. Every PhD begins with a Literature Review, surveying the state of knowledge in some particular area of scholarly knowledge, and surely a PhD in Data Analytics should at least try to make use of the tools of data analysis in that essential initial task!
Background Research
It turned out that what I was imagining is called a citation network or citation graph, which consists of nodes and edges.
Initial investigation confirmed I wasn’t the only one who might find such a thing useful: someone else (2011) was asking a similar question on StackExchange. I found a blog post from Mark Longair (2009) showing a graph of papers related to his thesis, scanned from PDFs he had collected. Andre (2015) had a very neat visualization comparing the citation networks of two related conferences, using “the force-directed layout engine included in d3.js”, and linking to some examples: Bostock (2017) and Raper (2014).
All this suggested that what I was imagining would be possible, but would also require enough effort to make it a worthy project for this assignment.
It also suggested some possible ways of going about the task, both with regards to data collection (webscraping information from Google Scholar or Microsoft Academic, or scanning it from journal article PDFs) and data visualization (using Graphviz or D3.js).
I also discovered Zotero, a “free and open source reference management system” which I hadn’t come across before starting this course (I finished my undergraduate degree in 2010, and haven’t been writing academic essays in the meantime). Zotero has a web browser plug-in which makes it simple to extract bibliographic information for literature referenced on the webpage you are browsing. I found that it uses this Wikipedia API to generate citation data given an ISBN or DOI.
Zotero allows bibliographic information to be exported as a .bib file, and I found that this can be parsed for Python by Pybtex: “a BibTeX-compatible bibliography processor written in Python” that can be installed with pip. Zotero generates citation keys at time of export “using an algorithm that usually generates unique keys” – Better BibTex is a plug-in for Zotero that gives better control over citation keys.
I also discovered Open Citations, “a scholarly infrastructure organization dedicated to open scholarship” and “engaged in advocacy for semantic publishing and open citations”. They also have an API, for retrieving data about citations (ie. not the bibliographic data for an individual item, but the relational data about what each item cites and is cited by), but its dataset seems currently quite sparse, at least for my field of study.
Software Design
Basic Functionality
I decided to try and write a Python program that would be able to read in data from .bib files, from PDF files, and from the Zotero/Wikipedia API. It would process this data to get bibliographic information (minimally Author and Year of Publication, but ideally also Title, Item Type, Publisher, etc.) and citation relationships. It would use D3.js Javascript running on a static web page to display the results as an interactive visualization, obtaining the relevant data from the Python program by fetch()ing it from an API served by our Python program using the Flask plug-in. The program would also write the results to a SQLite database file.
More Detailed Explanation (with UML Diagrams)
The essential software consists of five modules (run.py, db_commands.py, literature.py, reader.py, and tests.py), a static browser interface (static_gui\index.html, static_gui\graph.css, and static_gui\script.js), a SQLite database (citation_graph.db). If this database is deleted, any data it contains will be lost, but a new (initially empty) file with the same name will be generated when the program is next run.
There are also subfolders: test_output\ contains a logs.txt file with automated reports from the tests that were run as this program was written; docs\ contains all the necessary files for autogenerating Sphinx documentation (to rebuild the docs on Windows, one can simply run rebuild_docs.bat); bib_files contains .bib and .pdf files from which the program reads bibliographic and citational information; and of course .git\ makes sure that we can keep track of all of our version changes.
There are also a few other odd files:
Pipfile and Pipfile.lock are used by pipenv to load and keep track of the necessary virtual environment, and all its installed packages.
uml.bat (Windows) and uml.bash (Linux) call pyreverse to autogenerate UML diagrams, which are saved as packages.png and classes.png.
chromedriver.exe is necessary for the tests.py module to use selenium to control Chrome and test that the Flask API is working correctly.
.readthedocs.yml provides ReadtheDocs.org with the necessary information to generate and host documentation.
.gitignore tells git to ignore specified autogenerated files and folders which don’t need keeping.
static_gui\
index.html, graph.css, script.js
A simple static site interface is used for graphic visualization.
The static site interface (separated of course into its HTML, CSS, and JS components) is influenced by modern JAMstack principles which suggest enabling dynamic interactivity on fundamentally static web-pages by using front-end Javascript in combination with cloud-hosted APIs, which increases speed, security and simplicity compared to the traditional ‘dynamic web-page’ served live (most commonly with the LAMPstack).
As an example, I have set up a cloud-hosted copy of this program at citations.pythonanywhere.com, and a corresponding static interface on my own static site.
But a static site can also engage with an API served locally, as is the primary intention here.
Examine the source code directly for index.html, graph.css, script.js.
run.py
This is the main file intended to be run. It first opens static_gui/index.html in your default webbrowser, and then serves the Flask API which is called from that static interface. When called it responds with the required graph data by returning a JSON object with the necessary nodes and edges.
Read the full documentation here, or examine the source code directly here.
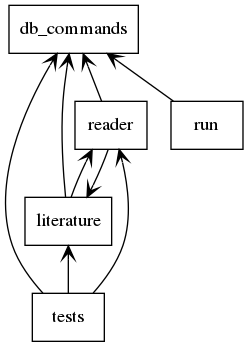
Figure 1: Module Relationships
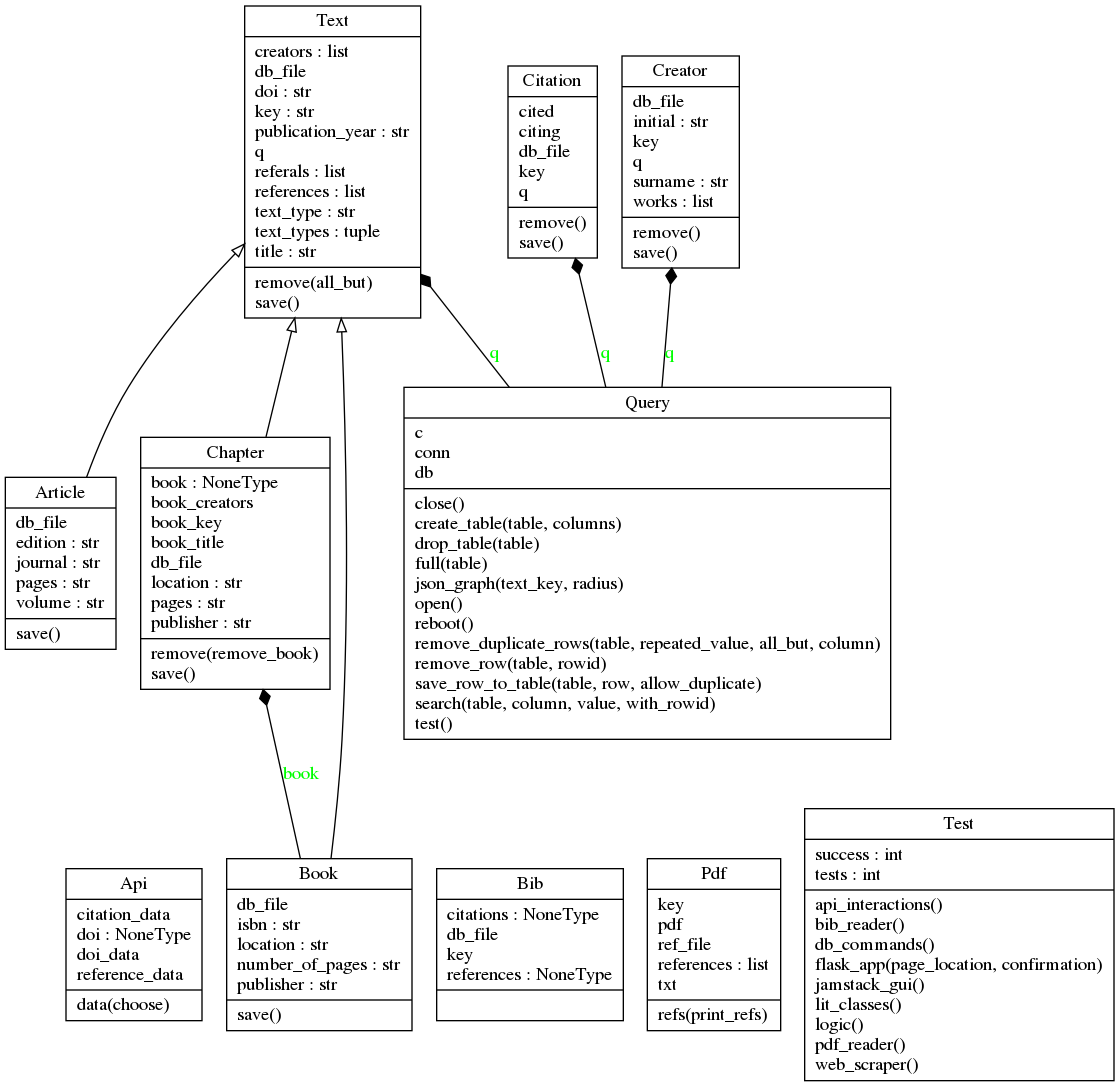
reader.py
Contains class frameworks for parsing data from .bib files (Bib), .pdf files (Pdf), and bibliographic/citation APIs (Api) respectively.
Can be run directly from the command-line if there is new data you want to save to the database, like so:
where citationkey is the citation key of a .pdf file (ie. citationkey.pdf) including references (ie. journal article or bibliography chapter) or .bib file (ie. citationkey_citations.bib or citationkey_references.bib) in the bib_files folder.
Running python reader.py load should load the six bib_files that I have already put in the folder as a demonstration.
NB: .bib files can be generated by Zotero, ideally using the BetterBibTex format [authForeIni][authEtAl][year]. Create a unique Subcollection with the item referred to by the citation key, together with a selection of works it references, or which cite it, and export it to a .bib file named accordingly.
Parsing .bib files makes use of Pybtex.
Parsing .pdf files makes use of Chris Mattmann’s tika-python library, which allows Python to use the Apache Tika toolkit for extracting data and metdata from PDFs. This does require that “Java 7+ installed on your system as tika-python starts up the Tika REST server in the background”. Which is an added complication – but it is quicker, more accurate, and simpler to use (Boylan-Toomey, 2018) than the other Python PDF libraries.
Once Tika has extracted the text from the PDF, it is then written to a text-file. This is then parsed using *regular expressions* for making sense of that data. Unfortunately the standardization of ‘Harvard style’ is still vague enough that there is a lot of variation, which makes it difficult to generalize a formula for automatically extracting the references from a journal article or book. Currently the algorithm is calibrated to read the references from our initial example starting point: Webber, R., Burrows, R., (2018), The Predictive Postcode; the reference chapter of which is saved as RWebberBurrows2018.pdf in the bib_files\ folder.
If you run python reader.py pdf citationkey the program will try to extract references from the file in bib_files\ names citationkey.pdf – note that currently the output from this may not be that accurate. If you just type python reader.py pdf it will default to extracting references from RWebberBurrows.pdf, as proof of concept. However, the almost 200 references that are then added do then over-dominate the visualization of citation relationships!
Read the full documentation here, or examine the source code directly here.
literature.py
Class frameworks for: Text, Book, Chapter, Article, Creator, Citation.
Book, Chapter, and Article are all daughter classes of Text.
All literature classes use Query() from db_commands.py to save data.
Read the full documentation here, or examine the source code directly here.
db_commands.py
Includes a variety of commands to make querying the SQLite database simple, encapsulated in a class framework called Query.
When run directly it builds the necessary tables to run the Citation Graph program, for if and when the database is deleted.
Read the full documentation here, or examine the source code directly here.
Tests
Throughout the development of this program, I am trying to practise the principles of Test-Driven Development (eg. Percival, 2017). This requires that before actually doing anything, we run a test that will check whether what we want to do is done. We run the test before writing the desired feature, so that it fails (obviously), then we write the feature, and then the test should run successfully.
Some Personal Concluding Thoughts
I’m fairly happy with how this has turned out, and I think it might be a genuinely useful tool as I begin these four years of work towards this PhD.
Jimmy Tidey was apparently able to scrape Google Scholar without any trouble to obtain a massive amount of citation data to graph the key authors in his field, but I found that if I tried to automate any extraction from their citation index, my program was immediately identified as a bot and my IP address briefly blocked from searching Google Scholar. Further research confirmed that I had apparently violated their Terms of Service.
My method of visualizing every single text dynamically as a node (whereas, I now note, Tidey shows authors, and his graphic is static) also means that it doesn’t take too much before the display is overcrowded – just extracting all the references from Webber and Burrows’ Predictive Postcode threatens to swamp everything else, and d3.js becomes quite slow with over a hundred nodal points shown.
There are various directions this could be extended with more time. My priority would probably to write a less precise, but more general, extraction script for other journal articles saved as PDFs – in retrospect, I should have done that before trying to fine-tune the extraction of all RWebberBurrows2018’s references.
Documentation
Documentation can be automatically generated by Sphinx, which I learnt to use for the previous project. For this to work we have to make sure we write proper docstrings. We use Google style, which means we require the Napoleon extension for Sphinx. We also use m2r to convert the README.md file to .rst so that it can be included.
Having generated it with Sphinx, we can also host the documentation freely at ReadTheDocs.org.